MARKET // ANALYTICS
CS2 Market Data Dashboard
A DeFi-style view of the Counter-Strike 2 economy: market capitalization, 24h & weekly trading volume, rarity dominance, top movers, and trade-flow analytics. Built from the live skin database and observed price history.
Market Cap
$273,159,666
48 skins priced
Volume 24h
$357,145
+10.51%vs prev 24h
Volume 7d
$2,411,316
-2.85%vs prev 7d
Volume 30d
$10,527,037
rolling window
Trades 24h
13,263
avg $26.93 / trade
Trade Volume
30-Day Volume Trend
Market Composition
Rarity Dominance
Restricted$146,908,890 · 53.8%
Covert$103,847,616 · 38.0%
Contraband$8,273,160 · 3.0%
Consumer Grade$5,709,600 · 2.1%
Industrial Grade$4,324,500 · 1.6%
Mil-Spec$2,781,000 · 1.0%
Classified$1,314,900 · 0.5%
7-Day Window
Top Gainers

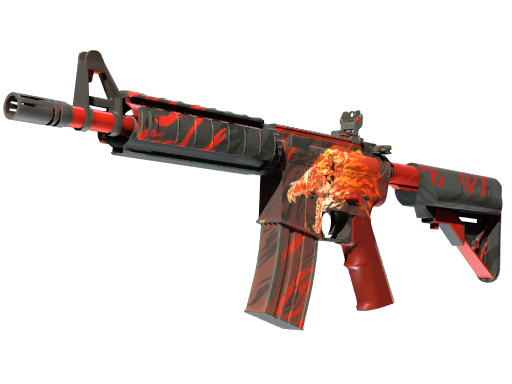
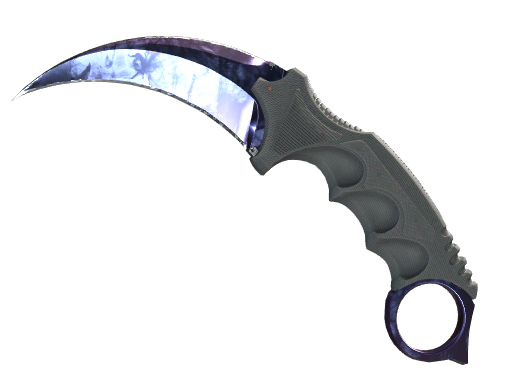


7-Day Window
Top Losers

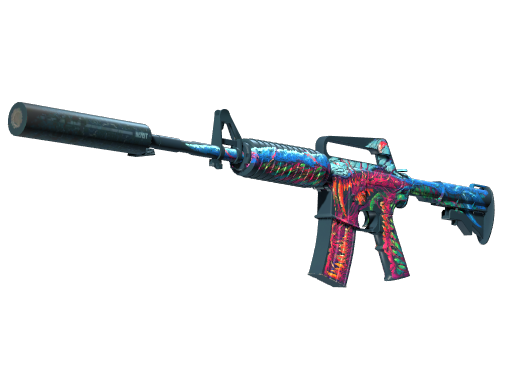
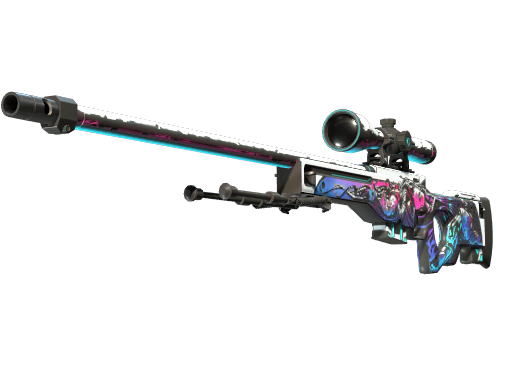

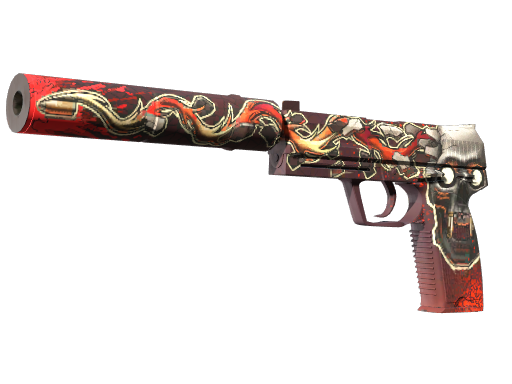


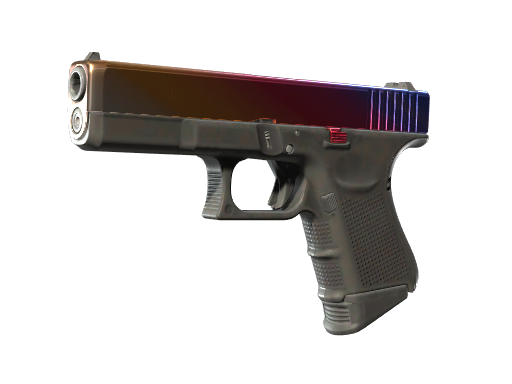
7-Day Window
Top by Volume
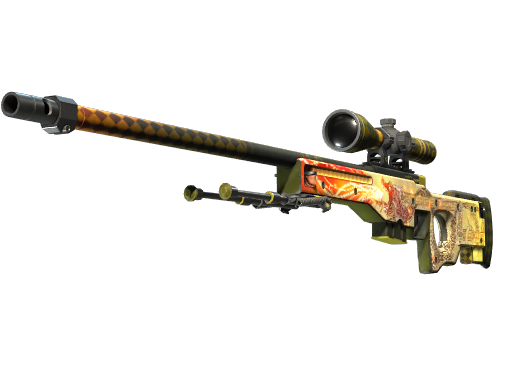


METHODOLOGY
Metrics combine real SkinPriceHistory snapshots with a deterministic synthetic model anchored on each skin's current listed price, rarity-based circulating supply, popularity and investment scores. Trade counts are estimated per skin per day and used to derive USD volumes. A live Steam Market / CSFloat data feed will replace the synthetic volume layer in a future iteration — the dashboard shape stays the same.